
1.Introduction
Isotype (International System of Typographic Picture Education), conceived by Otto Neurath (1882–1945) in the 1920s, became known worldwide in the 1930s as a statistical graphic method of using pictograms. Particularly in the United States, many ‘imitations’ influenced by Isotype emerged from around 1934 (Ihara, 2013). Concurrently, however, Isotype’s popularity also encouraged a search for new methods of expression beyond mere imitation. At the forefront of this effort was Rudolf Modley (1906–1976), who had worked at the Gesellschafts- und Wirtschaftsmuseum in Wien (Social and Economic Museum of Vienna) in the 1920s before moving to the United States in 1930 and founding his own organization, Pictorial Statistics Inc., in 1934. Modley’s first experiments with new representation methods were in what he called ‘pictorial diagrams’, which were not pictorial statistics. This experiment appeared as a cover design for Survey Graphic magazine, which began in 1937 and described it as ‘a new development and is not concerned with statistics; it simplifies and dramatises facts—the activities of an organization, the processes of soil erosion—but must be accurate and informative’ (Anon., 1937, p.489).
Worth noting is that this attempt is described as ‘dramatizing facts’, as facts-based creative expression was a widely common direction in the United States in the same period, characterized by the development of the documentary concept in photography and film (Stott, 1986). However, Modley’s efforts to dramatize fact reflected another uniquely American feature: a focus on the characteristics of comic culture as represented by cartoons. Two years later, Modley further developed this direction in the form of ‘picture books for grownups’, writing:
Yet there is a strange limitation to this technique. It portrays almost exclusively facts and conditions that can be represented by statistical symbols. And while statistics go far to describe important aspects of our social life, they cannot, except in the special case of statistical time series, do more than give a rather static picture. Even when many statistical charts presenting such pictures are combined, they do not succeed in telling a continuous story. A new dynamic method of graphic presentation had to be developed to achieve this purpose.
(Modley, 1939, p.153)
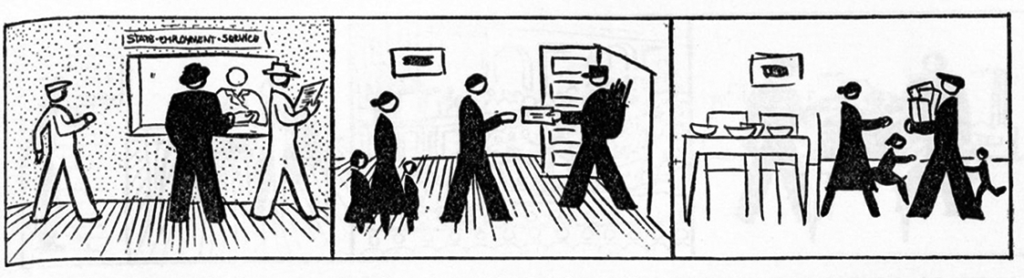
Here, the ‘new dynamic method of graphic presentation’ refers to a pictorial diagram appearing as a continuation comic (Figure 1). Furthermore, Modley envisages that such a direction would lead to animation as follows:
The development of pictograph technique toward more dynamic presentations has brought it very close to the motion picture—a motion picture that opens new vistas to education. Mickey Mouse is about to get his Ph.D. and teach economics.
(Modley, 1939, p.155)
In 1937, Modley began experimenting with pictograph animation, but his attempts ended in mere experimentation; instead, he continued exploring pictorial diagrams in books, newspapers, and other printed media. Meanwhile, Neurath has also been interested in the potential of pictorial statistics as animation since the end of the 1920s, and after 1942, when he went into exile in England, he began producing Isotype animation in collaboration with the documentary filmmaker Paul Rotha (1907–1984) (Burke & Haggith, 1999). In this sense, Modley’s suggestion regarding the prospect of animation was not his original vision but rather a widely common trend of his time. In fact, Modley and Neurath were not the only ones who envisioned animation as a direction for Isotype’s development; at this time in the United States, a designer named Philip E. Ragan (1909–1989), who had also been aware of the direction of pictograph animation, tried to explore its possibilities.
Influenced by Isotype, Ragan produced pictorial statistics in the mid-1930s. In 1940, the National Film Board of Canada (NFB), headed by John Grierson (1898–1972), asked him to produce propaganda animations, which Ragan began to work on using pictograms. Furthermore, he also produced and animated the well-known film One World or None, which was released in 1946 just after the war, calling for the worldwide control of the atomic bomb, in what has been described as the ‘Disney of scientists’.
This paper discusses one of the outcomes of the expansion of pictographic animation from Isotype to Ragan’s work, which specifically marked the continuity between still graphics and animation. In addition, although pictographic animation is currently an extremely popular technique in contemporary information motion graphics, no historical research has been done on the subject, with a few exceptions (Ceccarelli, 2011; 2012), thus the focus on Ragan’s work. However, in the absence of any thematic study of Ragan himself, and given the scarcity of material on his career, this paper will be limited to a general picture of his work, focusing on the process that led him from his early work in statistical visualization to animation.