1.Introduction
This presentation explores the variety of pictograms used before the publication of Dreyfuss’s Symbol Sourcebook on January 1, 1972, focusing on the rarely discussed North American animated film pictograms produced during the 1940s.
Dreyfuss’s Symbol Sourcebook was conceived during a trend toward symbol standardization in the 1960s. However, it did not include pictograms in motion, instead focusing on those used in public spaces and on devices. However, pictograms have been used in various ways, including pictorial statistics represented by Isotype (International Pictorial Language), often considered a pictogram pioneer. Especially during the 1930s and 1940s, the genre of expression related to pictograms significantly expanded. One expansion was the development of animated pictograms on film. Although Isotype animation is well known as animated pictograms on film, few know that films using animated pictograms were also produced in North America during the same period. One leading animator was the architect Philip Ragan, who began creating pictorial statistics in the 1930s. He was influenced by isotypes and produced over 30 animation films for the National Film Boards of Canada (NFB) during the Second World War. He was probably the first designer to use “pictograms in motion comprehensively.”
Because I have previously written an overview of Ragan’s work, here, I attempt to summarize the characteristics of his work produced for the NFB in terms of pictograms and animation. Next, I explore attempts at animated pictograms in other documentary films and animations during the same period. Through these surveys, the possibilities of pictogram animation will be discussed.
Until the late 1970s, when the term “pictogram” came into common use, the word “symbol” was used. Nevertheless, this paper adopts “pictogram” because “symbol” is often used differently in animation, frequently in a psychological sense, so even though it is an anachronism, I decided to use “pictogram.”
2.Ragan’s Animation with Pictograms for the NFB
In the 1930s, many designers created pictorial statistical charts based on Isotype, which was then becoming known in the United States. Among them, Philip Ragan, who founded and played a central role in Sociographic Philadelphia, stood out for his unique pictogram design style. Ragan graduated from the University of Pennsylvania’s School of Architecture and studied at l’ Ecole des Beaux-Arts in Paris.
Ragan’s name did not appear in publications until shortly after his graduation in 1934; however. He first published in a special issue of the Pennsylvania Department of Labor and Industry Bulletin in July1934 (Figure 1). Around 1938, he began designing charts for Works Progressive Administration (WPA) publications, for instance, illustration for The Right to Work by WPA Administrator Nels Anderson, one of the now modern-age books in the series (Figure 2). After 1940, he intermittently designed charts for Fortune magazine.


In addition to these graphic works, Ragan seems to have begun experimenting with animation using pictograms around 1937. According to a document, this experiment was a cut-out technique: “objects and figures were to be cut from Bakelite and animated mechanically instead of by drawing separate pictures for each motion of the object.” (WPA 1939) The only work from the 1930s that has so far been identified as Ragan’s animation is “Is work relief better than the dole?” Created for the WPA, this work represents the results of a questionnaire survey on nine WPA policies. No credit is given, but it is Ragan’s chart. However, the film is not exactly animated, as the only movements are fade-ins and fade-outs as the scene changes.
In 1941, Ragan contracted with the NFB to produce propaganda films. Why Ragan, who had minimal experience in film production, was hired remains unclear. Still, he has been hired to supplement the number of animation-production contracts the NFB had with Walt Disney Studios, despite the NFB already having such an animation-production contract with Disney. In any case, Ragan began producing animation in earnest in 1941.
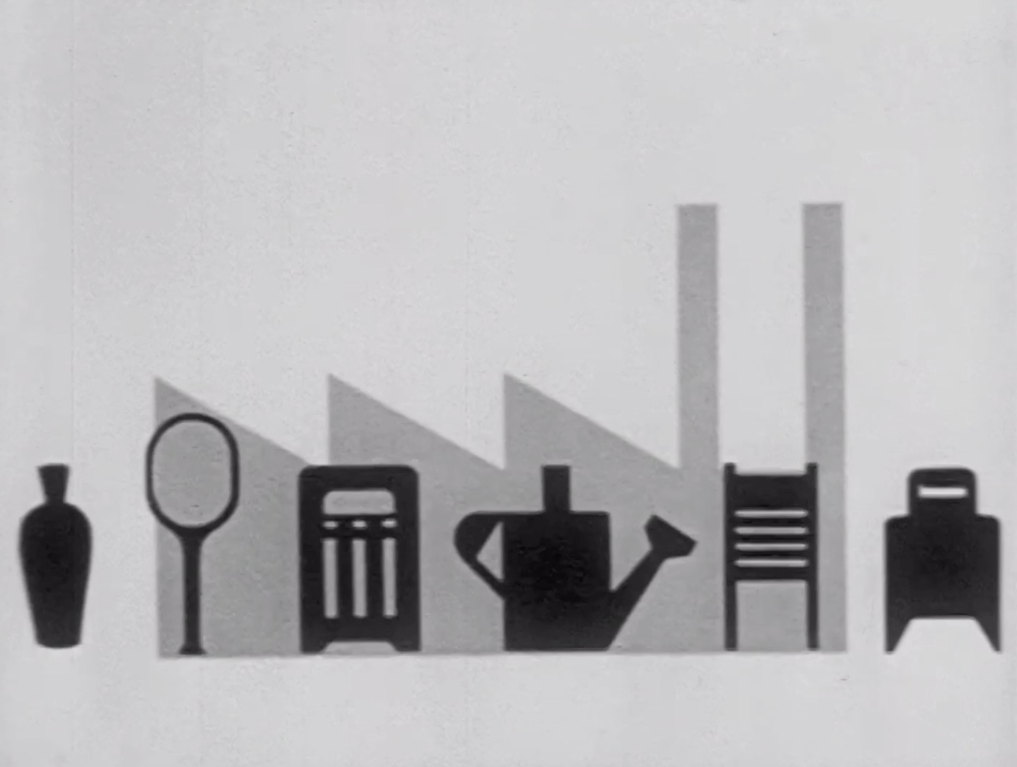
The first film produced was “Control for Victory” (1941 (1942)), which illustrates the need for government price controls. Importantly, it contains scenes showing continuity with the artist’s experience designing pictorial diagrams for printed materials (Figure 3). The film consists of two parts, the first representing factories, stores, and government agencies in white on a black background and pictograms representing workers and products moving among these buildings. The overall design seems to have been based on pictorial diagrams in publications such as One Year of WPA in Pennsylvania (Figure 1) or Nels Anderson’s The Right to Work (Figure 2). The second part differs in style, with a white background with identifiable pictograms of workers and dramatic content, for instance, scenes of workers competing for dwindling consumer goods.
Since then, Ragan’s animations generally mixed these two types, with their difference in discourse formulated as conceptual or narrative. In pictograms of narrative discourse, the pictograms play the leading role in detailed movements. In conceptual discourse, abstract relationships among pictograms play the leading role.

Narrative Discourse
Narrative discourse in a series of 12 animated films includes Plugger, who has a wife, a son Johnny, and a daughter Jenny. Although Plugger became a popular character, his shape was appropriated almost directly from the Sociographics Philadelphia symbol (Figure 4), which depicts a man in profile with his legs spread wide and wearing a bird strike cap to represent a worker. In addition, the pictograms of Plugger are identical to those of workers, who are devoid of individuality.

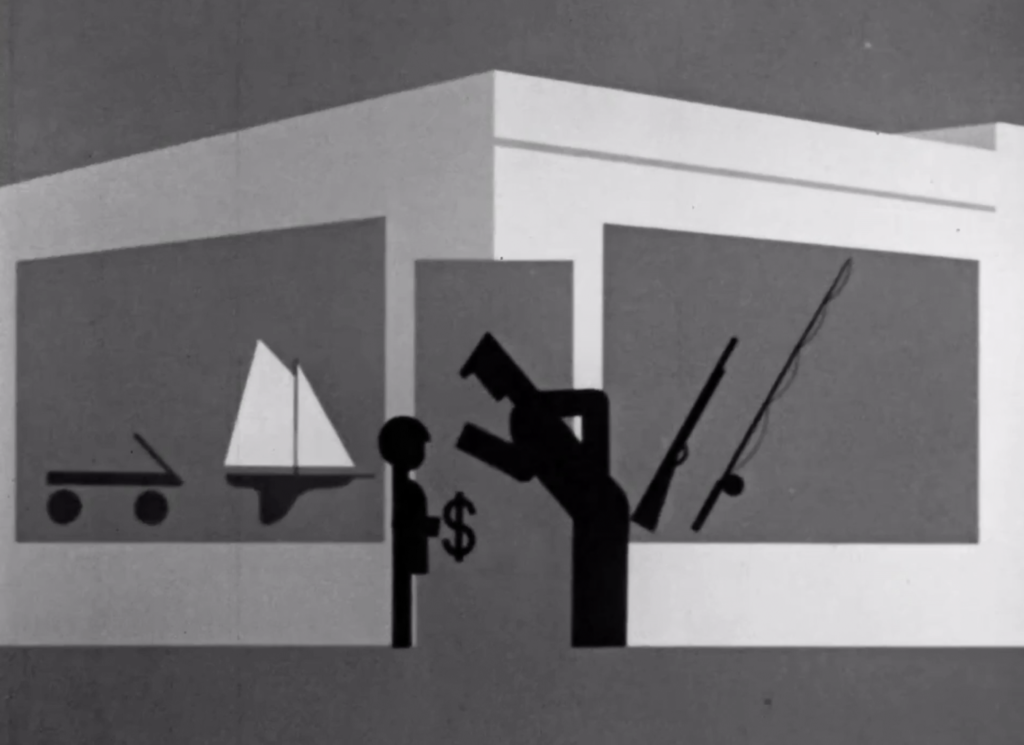

Pictogram characters’ eyes, noses, and mouths, necessary for expressing emotions, are omitted. Compared with typical animation, these characters use exclusively exaggerated gestures to express intimidation, disappointment, and anger (Figure 5). Compared to silhouettes in animation, for example, ‘shadow animation,’ which is a genre of expression, expressing emotions other than by exaggeration in pictograms that omit details is difficult. They are recognizable as characters mainly due to their exaggerated gestures and narration. When Plugger is placed in a home, factory, or store, including scenes of conceptual discourse, the central movement is exclusively walking. Since the standard posture is with the legs wide open, walking is a large-legged motion, reminding us of a robot soldier’s marching and enhancing the movement’s visibility (Figure 6).
Changes in Plugger’s posture sometimes indicate differences in meaning. For example, a worker’s change from a normal posture to a slumped-shoulder posture shows a change in emotion or feeling and, given the Great Depression’s time frame, that s/he has become unemployed (Figure 7). Conversely, when an unemployed person finds a job and engages in work, the posture changes to upright, thus taking advantage of pictograms’ characteristics.


Conceptual Discourse
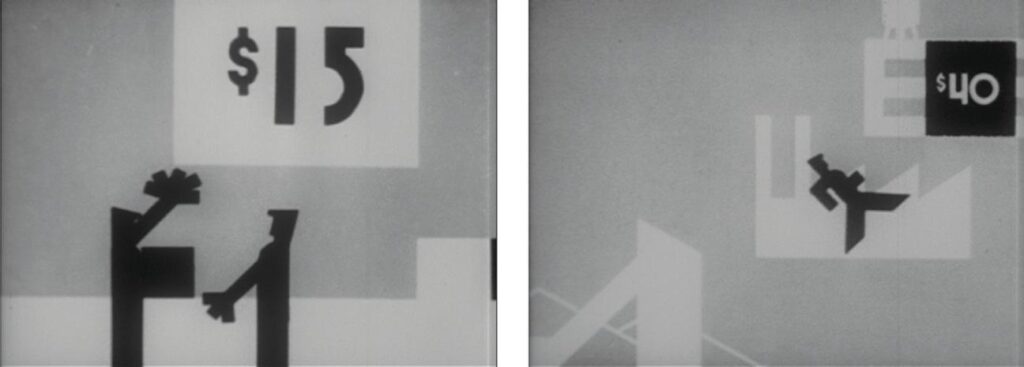
As a conceptual expression, a recurring and representative theme in Ragan’s films is economic events, especially inflation and its suppression, which has increased since 1943. In the films How Prices Could Rise (1944), Providing Goods for You (1944), and Money, Goods, and Prices (1945), money and goods play the leading roles, and the mechanism of inflation is explained by adding consumer purchasing behavior. In the background are pictograms of organizations or facilities such as a house, factory, store, and government agency, and a conceptual diagram represents their relationships. In Control to Victory, for example, based on a horizontal and vertical grid, pictograms representing a store and a government agency are placed below the factory; other pictograms representing products are dispersed and moved among them to represent civilian goods’ wartime decline in production. When the relevant organization for government economic control appears, it is placed at the top. Its role in procuring raw materials for the war effort and adjusting prices to control inflation is explained. More complex diagrams, such as in Money, Goods, and Prices,show pictograms representing stores, factories, farms, and government agencies arranged in a circle with a house in the center, surrounded by pictograms of forts (Figure 8). A significant characteristic of such diagrams is that, unlike realistic representations, differences in the pictograms’ sizes are ignored.

Several innovations in animation techniques for pictograms prevent monotony in later works, for instance, in Providing Goods for you, which appeals to restraint in the consumption of civilian goods during wartime: The film attempts to explain the necessity for control through the connection between goods and the global economy rationally. The film begins in a store where people are shopping. Pictograms representing products are on display shelves, and in one scene, these pictograms are mapped in circles to specific global production areas (or raw material production areas). The rings are gathered to form a single flowing curve obstructed by enemy attacks, thus explaining the need for a United Nations wartime economic system. From the same perspective, Mutual Aid (1944) also deserves special mention. In this work, a moving ship drawn in three dimensions is transformed into an abstract arrow, then replaced by a continuous line. Such transformations are common as a general animation technique. Still, when applied to flat pictograms, the effect is almost magical and therefore cannot be found, for example, in Isotype animation.
The Road Ahead (1945) showcases various services for discharged soldiers’ rehabilitation before the war’s end. The film opens with scenes of fighter planes shooting and bombing and submarines firing torpedoes; it repeatedly depicts such scenes approaching the viewer so that the animation’s methodological motif is the zooming-in motion itself.
The rehabilitation program is sequenced according to a flow diagram with intersecting branches representing vocational training, compensation, etc. The flow diagram is drawn in perspective, gradually zooming-in with each turn. The road’s destination is the coast, but further, out to sea, the path widens; as the horizon becomes the round Earth, the path converges to the center. Finally, the diagram conveys the message that international cooperation after the war is the future’s goal. Thus, this is an interesting work that expresses an abstract flowchart in three dimensions using perspective and the chart’s development through the movement of the viewer’s gaze along the axis.
Summary Characteristics of Ragan’s Animation with Pictograms
The shift in Ragan’s production trend from narrative to conceptual discourse suggests that he focused on the latter: visualization of economic institutions. This can be explained in that many of Ragan’s New Deal charts deal with socioeconomic institutions, such as the WPA’s unemployment measures, especially workers’ compensation. On the other hand, Ragan’s entry into animation seems to have inevitably involved him in a competitive state of expression unique to the field. Ragan had demonstrated his strength in unparalleled expression of animation using pictograms, but similar attempts began to appear during the war. Around 1944, Ragan began producing works that incorporated live action and animation, which seem to express his growing awareness of pictograms’ limitations in animation.